Graph of Footfall Figures at Fleet Pond for 2016 (Click To Enlarge)
Answer: A lot more than you might imagine!
Colin Gray, Chairman of Fleet Pond Society, writes:
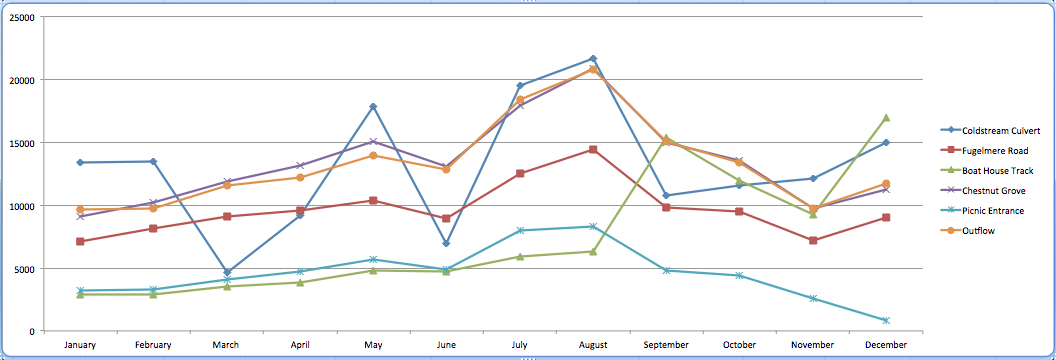
“Hart Rangers have provided me with the full year footfall figures for Fleet Pond as recorded at the six monitoring points (see legend on graph above plus map here).
They make interesting reading and there is one oddity and one that bucks the general trend. Most monitor points follow a similar trend over the year, but Coldstream Culvert shows an unusual drop in March, April and June. Boat House track bumbles along as one of the lowest until a sudden increase in September, drops in the next two months and then becomes one of the highest in December.
Picnic entrance is one of the two lowest all year, indicating perhaps that most walkers use the lower track?
What is very clear is the numbers of people using Fleet Pond every month. Back a decade when we had a Farnborough Sixth Form student take a survey over a shorter few months, his figures estimated approximately 4,000 to 5,000 a month in peak months. All but two monitor points show the numbers are now well in excess of that estimate every month.
An important point to note is that the monitors record every movement past the monitor, so it includes those who walk, jog, run or walk dogs more than once a day or do more than one circuit of the pond. For example a jogger might pass the monitor three or more times in one day. Although these might swell the figures, they do have an impact on the path network, so it makes sense to include them when assessing impact on path maintenance and potential disturbance.
There is no denying just how popular and valuable Fleet Pond is to people and their health.”
You can read the interesting things that visitors say about taking walks around Fleet Pond via TripAdvisor here.